Optima
Training Intelligence · Adamas
Built for the self-coached lifter who has already optimized their program but lacks the execution layer — progression timing, nutrition drift, recovery load. You log; Optima interprets.
Context
Optima is a multi-surface training-intelligence app for self-coached lifters. It integrates five modules — a 3D anatomical muscle-coverage heatmap, programming with progression intelligence, a daily weight and nutrition log, sleep and recovery tracking, and a dashboard that synthesizes across all of them — under one auth and subscription system.
The Problem
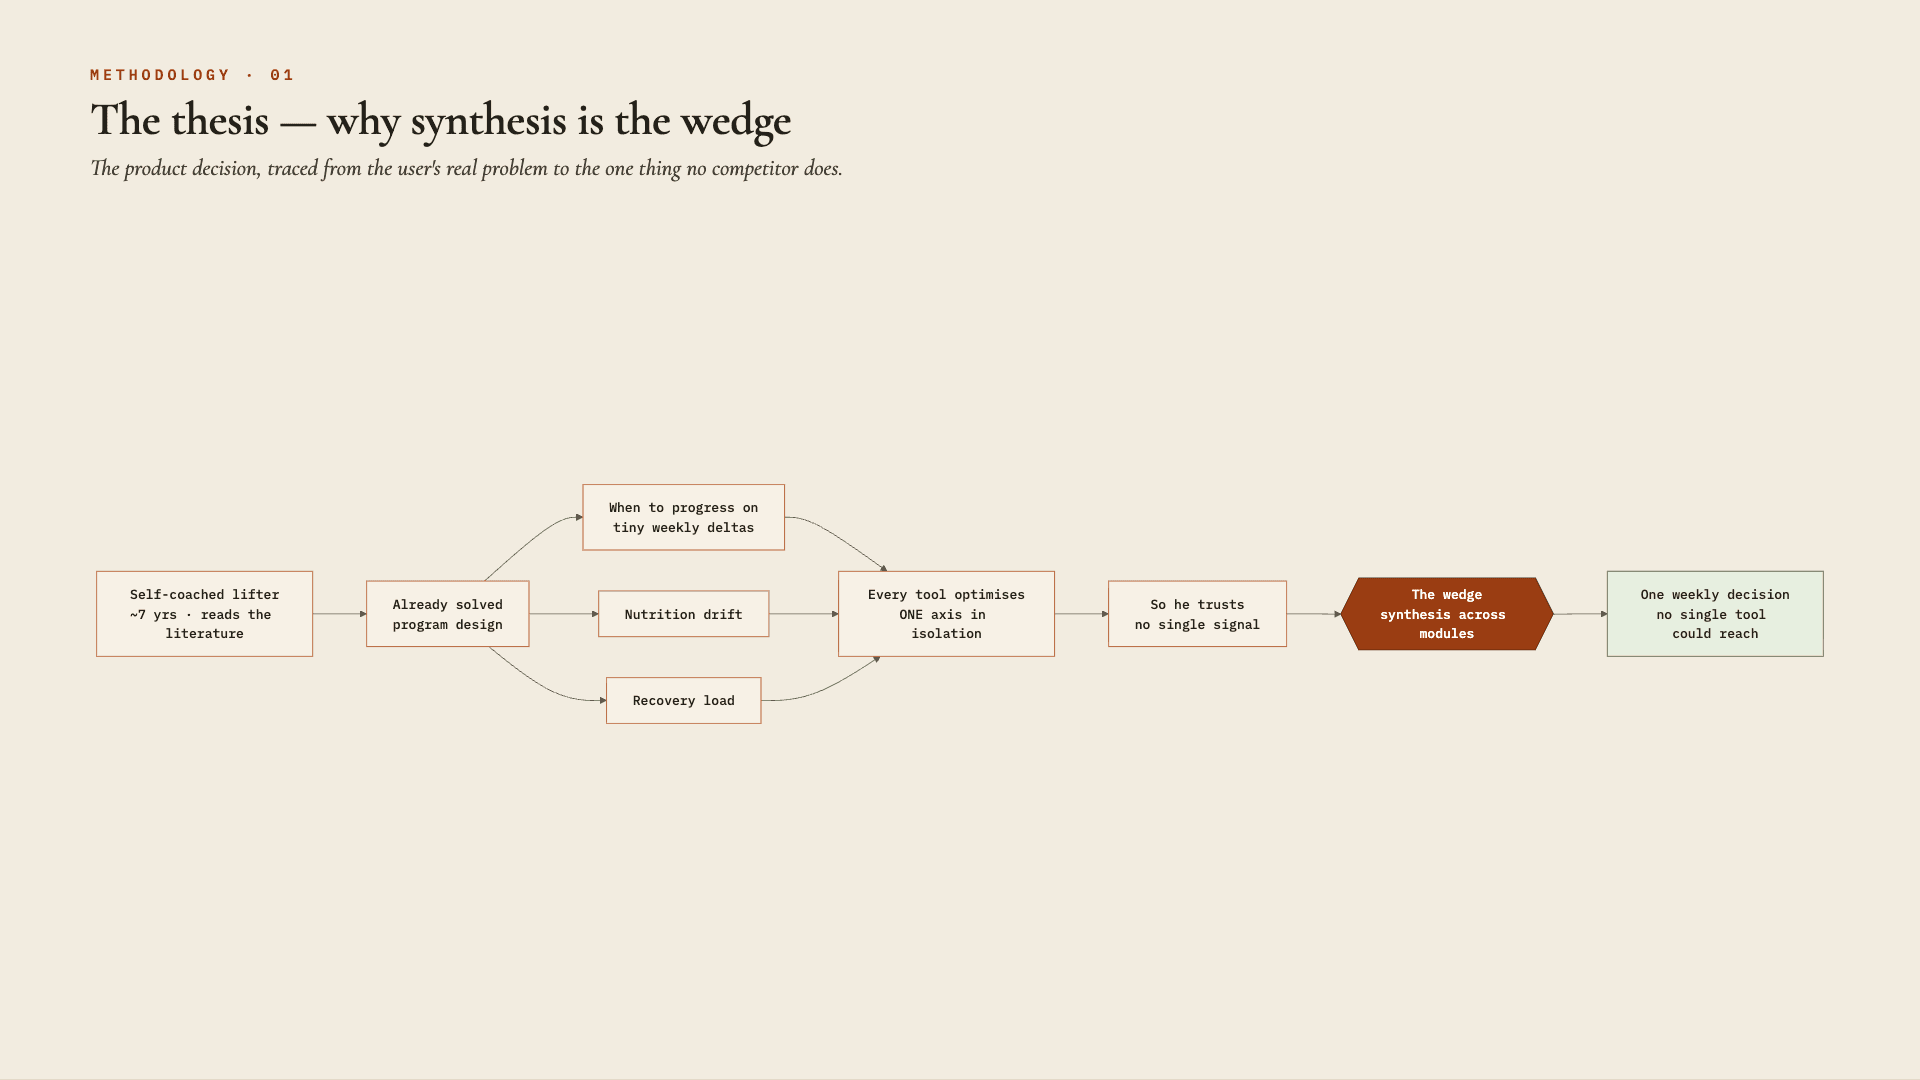
The target lifter has roughly seven years under the bar, reads the science-based literature, and has already solved program design. What they struggle with is the meta-layer: when to actually progress on a low-volume routine where weekly deltas are tiny, how to read nutrition drift, and how to manage recovery. Every existing tool optimizes a single axis in isolation, and this user doesn't trust any one signal on its own.
Constraints
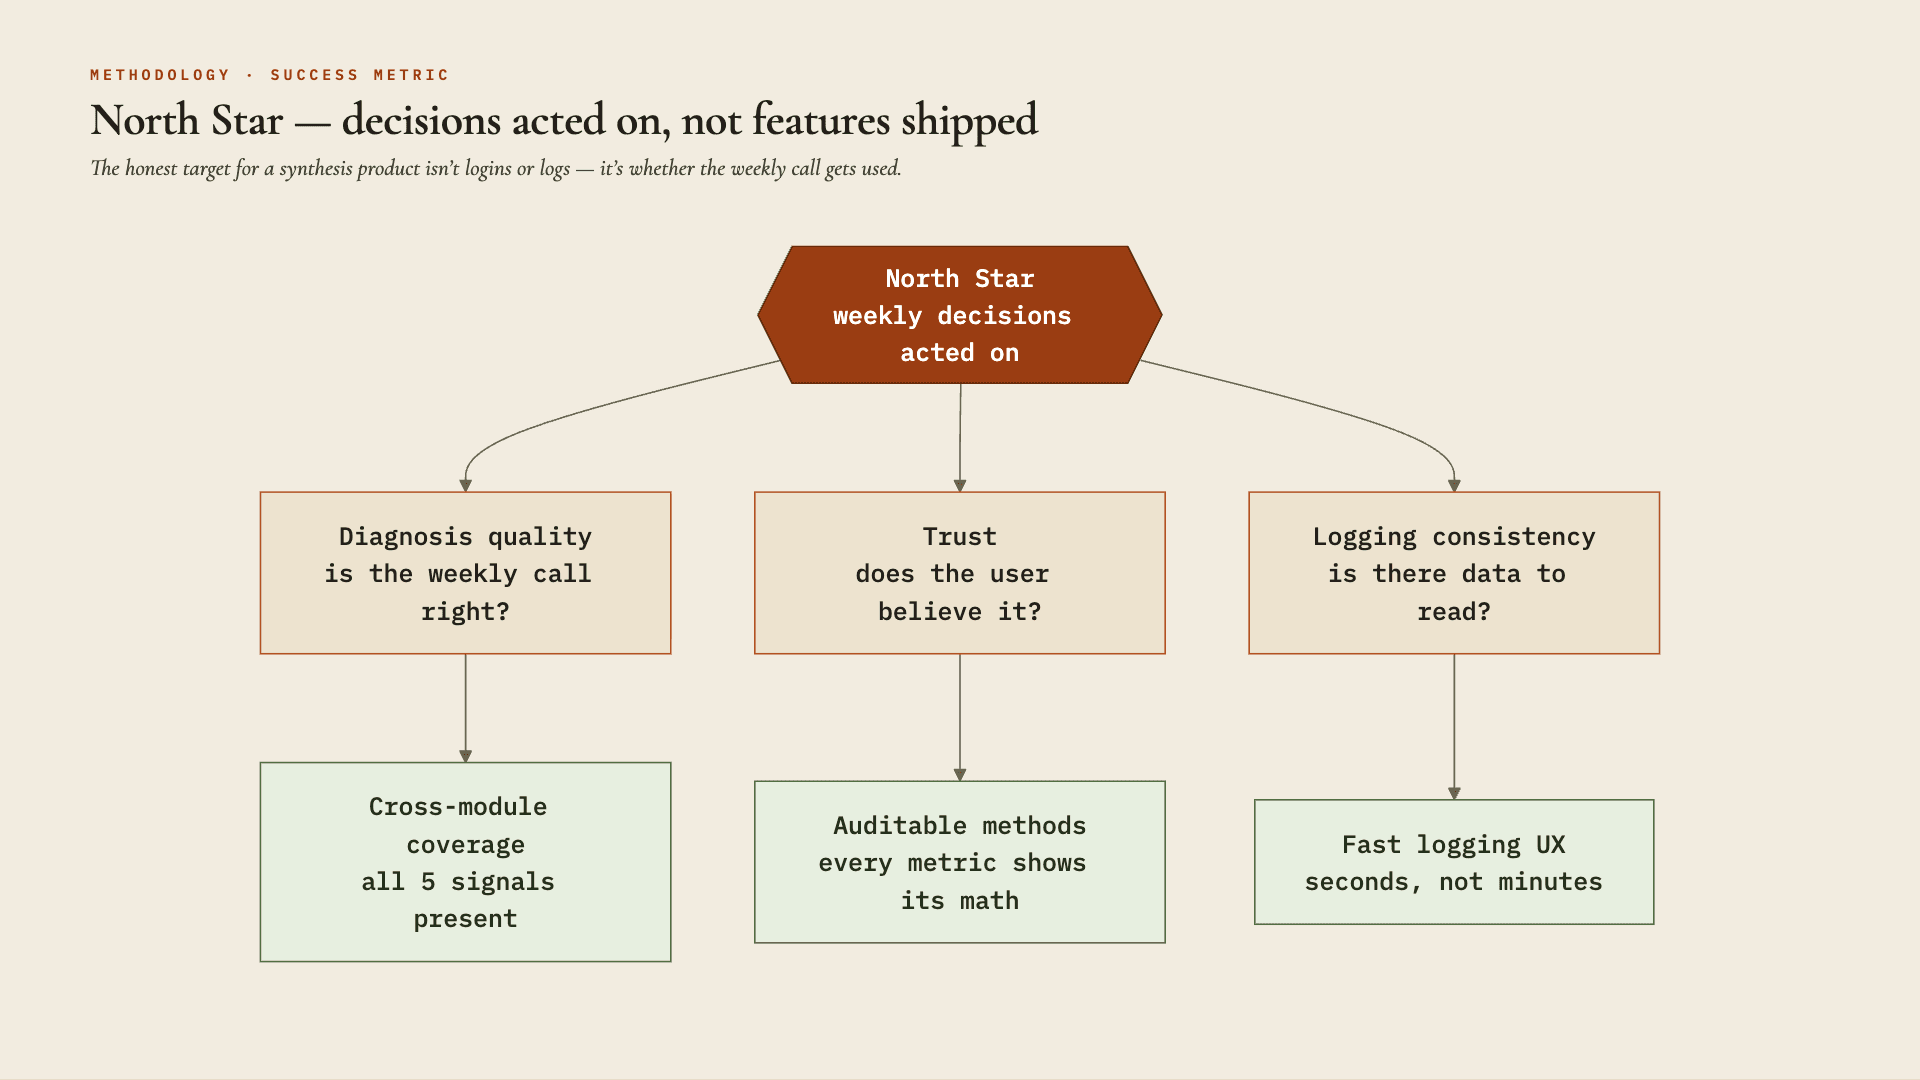
The science-based lifter is the harshest auditor. Every computed metric has to expose its math via methods modals or inline citations — no black-box scores ship.
The dashboard must resolve to one sentence per week that names the actual bottleneck, not a wall of widgets.
Five modules with independent state had to read across each other without becoming a tangled monolith.
Real-time 3D anatomy, virtualized tables, and chart projections all inside a mobile frame budget.
Strategic Approach
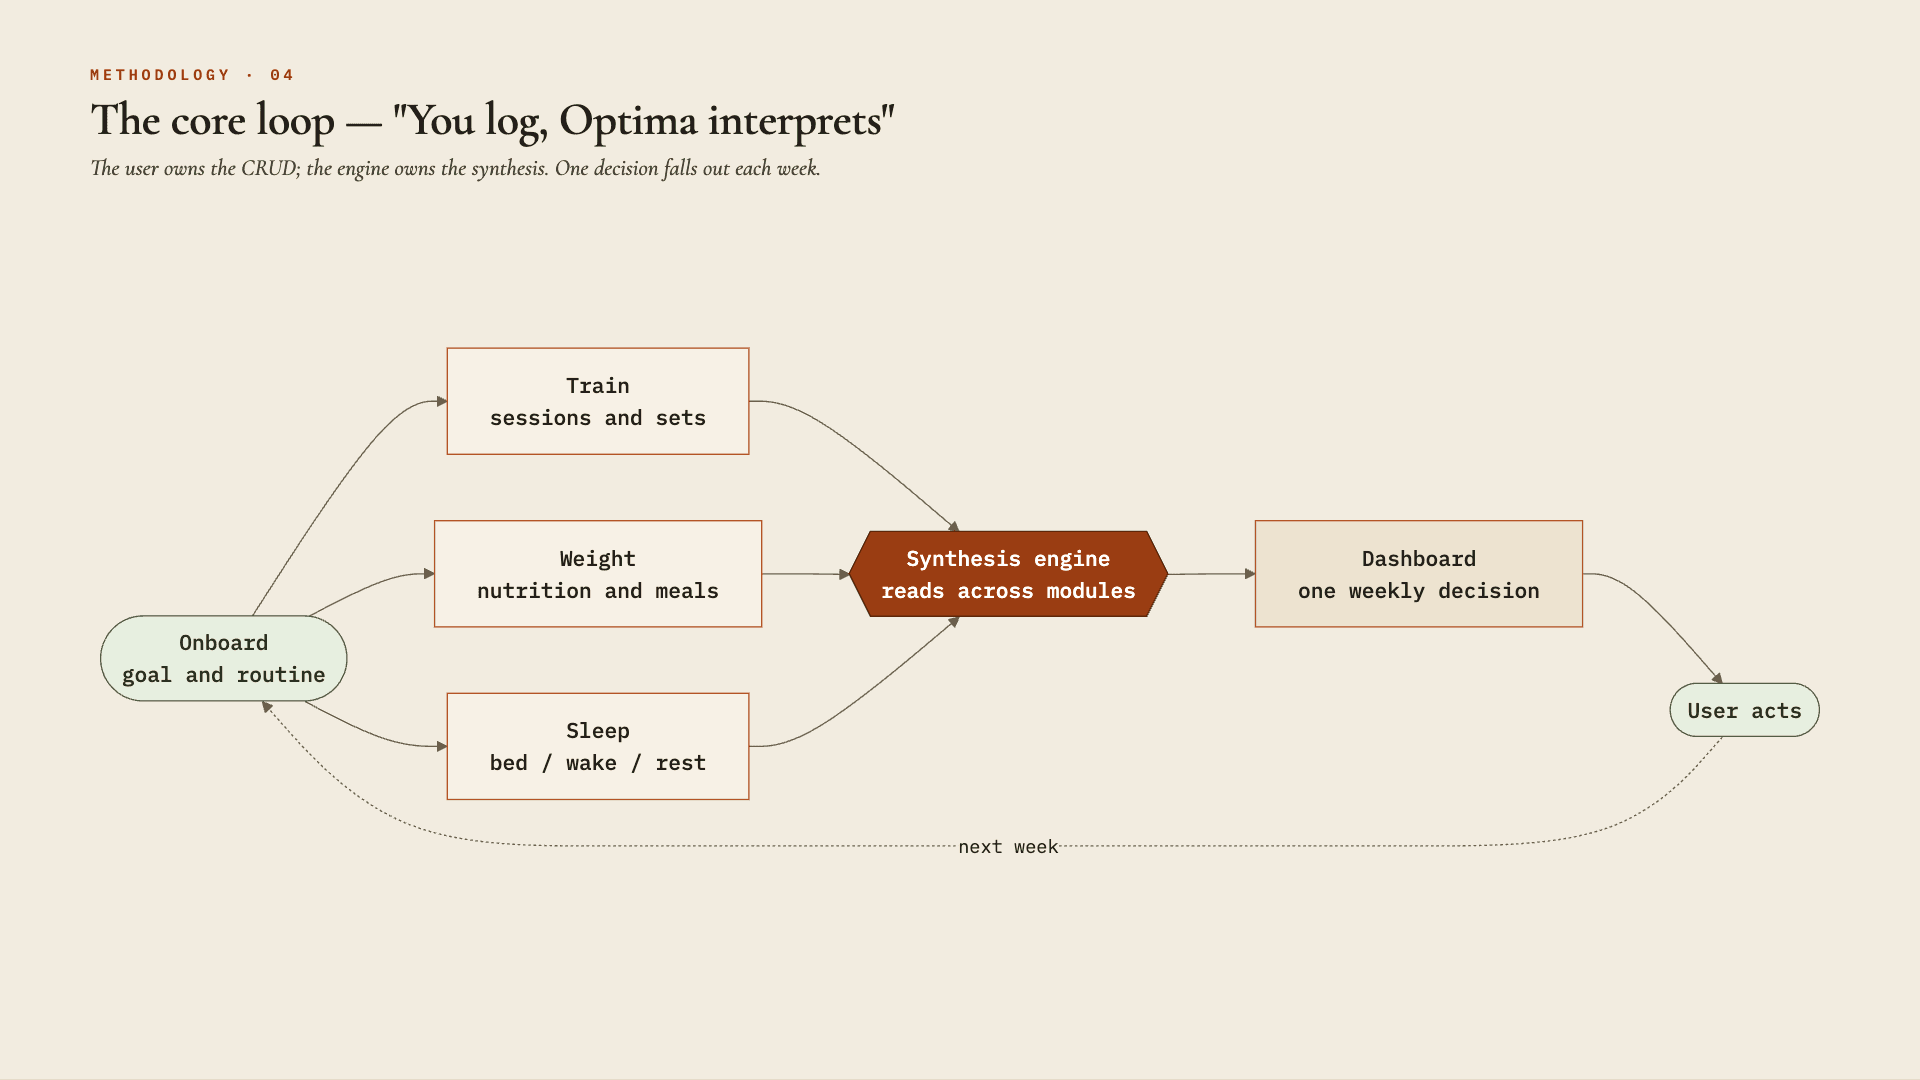
The core principle is a division of labor: 'You log, Optima interprets.' The user owns the CRUD — training logs, weight, sleep — and Optima owns the synthesis across them. The dashboard hero is the north star: one decision a week that no single module could produce alone. Everything is auditable by design, so the credibility persona can verify the reasoning rather than trust a number.
Execution
Anatomical Heatmap
Built the client-side 3D muscle-coverage map (React Three Fiber + Three.js) with a gap legend and frequency analysis — the credibility anchor that works without login.

Programming & SRI
Designed the Stim-to-Recovery Index (yield ÷ cost) from a three-component fatigue model and backfilled all 195 exercises with SRI metadata, surfaced on every exercise A/B card.

Weight & Recovery
Shipped a dense weight/nutrition surface and a sleep dashboard with regularity index, calendar heatmap, and forward projections — research-grounded in RT-hypertrophy literature.

Cross-Module Synthesis
Wired the modules together so sleep restriction re-ranks training toward lower-cost lifts, and the dashboard reduces all signals to a single weekly decision.

Outcomes
Shipped a multi-surface product: a 3D anatomical heatmap, a stim-to-recovery progression metric, and a cross-module weekly synthesis.
Impact
- •Turned five independent fitness signals into a single weekly decision the user couldn't reach from any one tool.
- •Made rigor the product: methods modals and citations let the most skeptical user verify, not just trust.
- •Established a modular architecture where each surface ships independently but reads across the others.
Reflections
Decisions, tradeoffs, and what I'd change.
- 01
For an expert audience, transparency is the feature — every metric shows its math through a methods modal rather than shipping a prettier black-box score.
- 02
Chose Chris Beardsley's stimulus-to-fatigue framing for the SRI metric over weekly-volume models, and deliberately dropped HRV scoring: local muscle recovery, not CNS strain, is what drives per-lift progression.
- 03
The honest gap: the dashboard answers 'this week' well, but true longitudinal cross-module attribution is where the real moat sits — and that's still ahead of me.
- 04
On the surface that sells, taste beats analysis — I kept the 'Your plateau, over' headline over a technically 'stronger' line because it landed harder.
Gallery

Positioning: every competitor optimises one axis or hides its math. The open quadrant is synthesis you can audit.

Problem frame: the job isn’t “track my workouts” — it’s “which axis matters this week,” the question no tool answers.

Sequencing: heatmap first as the no-login acquisition wedge, then the data layer, then the synthesis moat.

First-run journey: the heatmap earns trust before the wall — the skeptic sees value before being asked to sign up.

Personas: two lifters, one shared trait — they distrust any single signal.

And it ships: the dashboard resolves five live modules into one weekly call — “bench stall, likely recovery.”