BrandServe
Site Visitation Analytics
For physical venues that want to understand who visits, where they come from, and how long they stay — all parsed and rendered client-side, with an AI assistant for plain-English queries.
Context
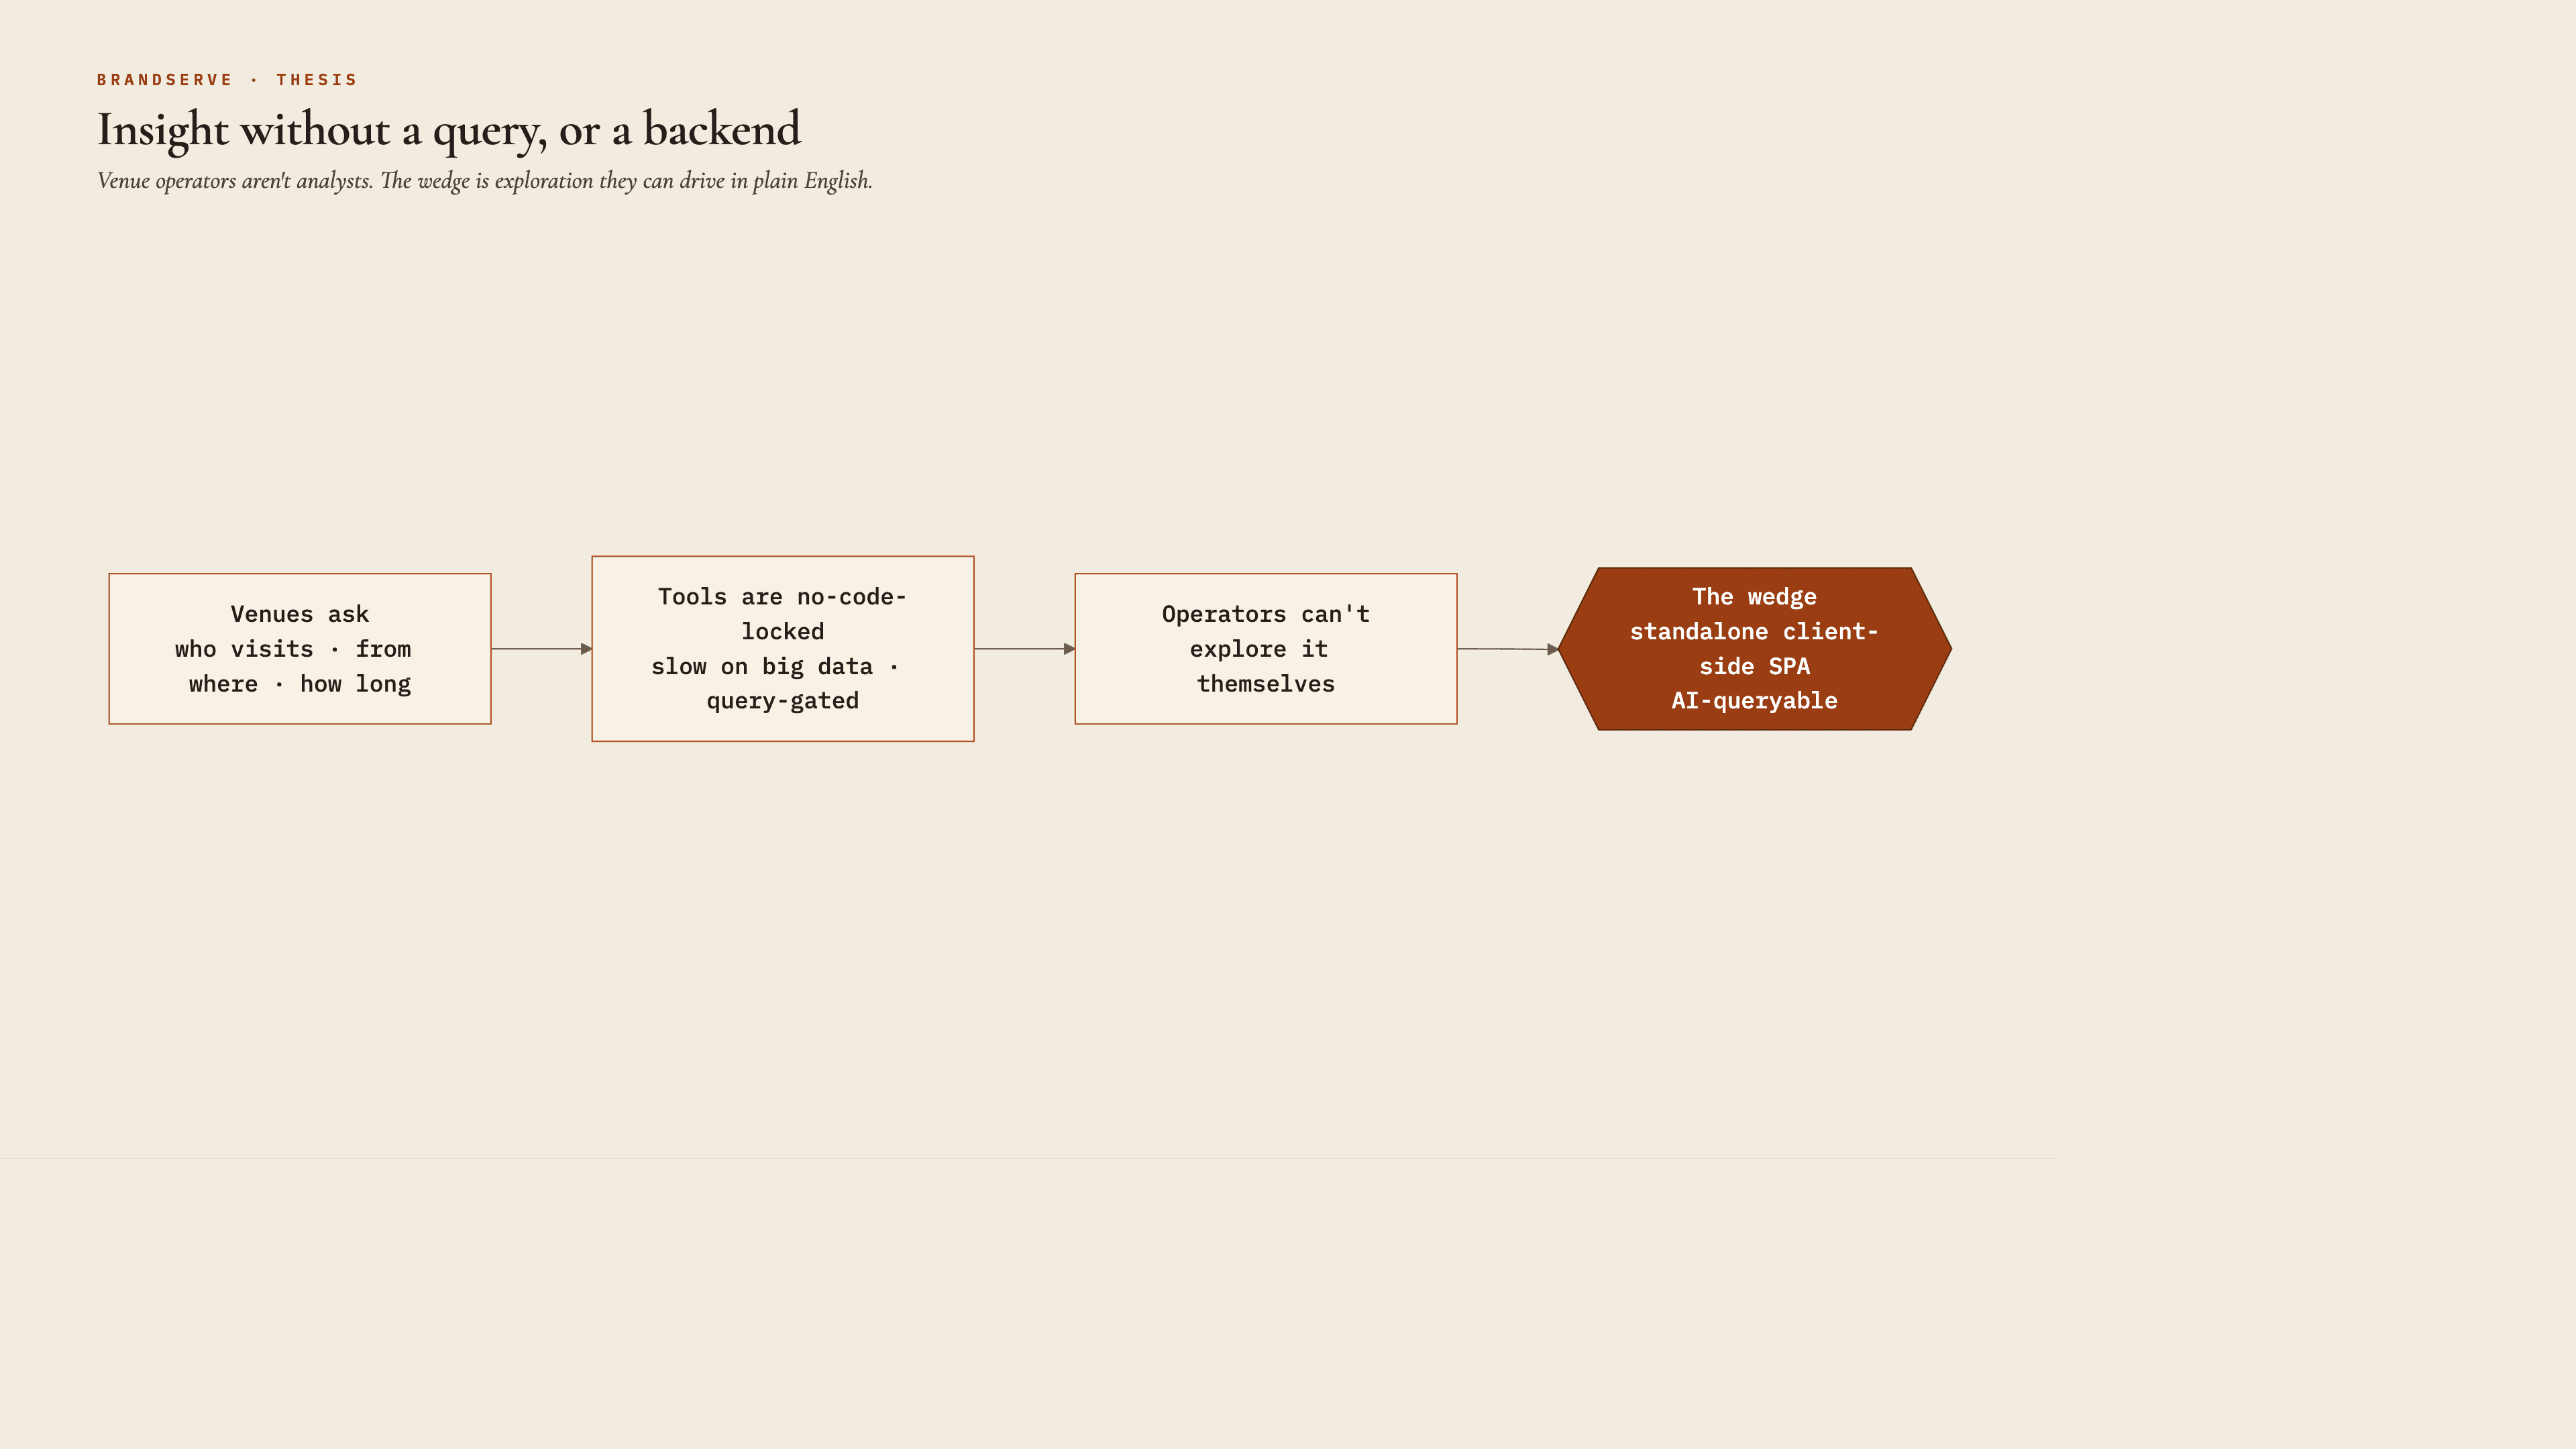
BrandServe is a site-visitation and analytics dashboard for physical locations — retail and recreation venues like aquatic centres. It ingests mobile-device tracking data and combines it with census data to visualize foot traffic, visitor origins, catchment areas, demographics, and segmentation, with an AI assistant (Kodee) for natural-language queries.
The Problem
The original platform depended on a no-code cloud host (Base44), which limited control, portability, and performance on large datasets. The product needed to stand on its own, handle very large visitation files without falling over, and let non-technical venue operators explore the data without writing queries.
Constraints
Remove the no-code platform dependency entirely — the v2.0 runs as a standalone SPA with no backend API calls, parsing and storing uploads client-side.
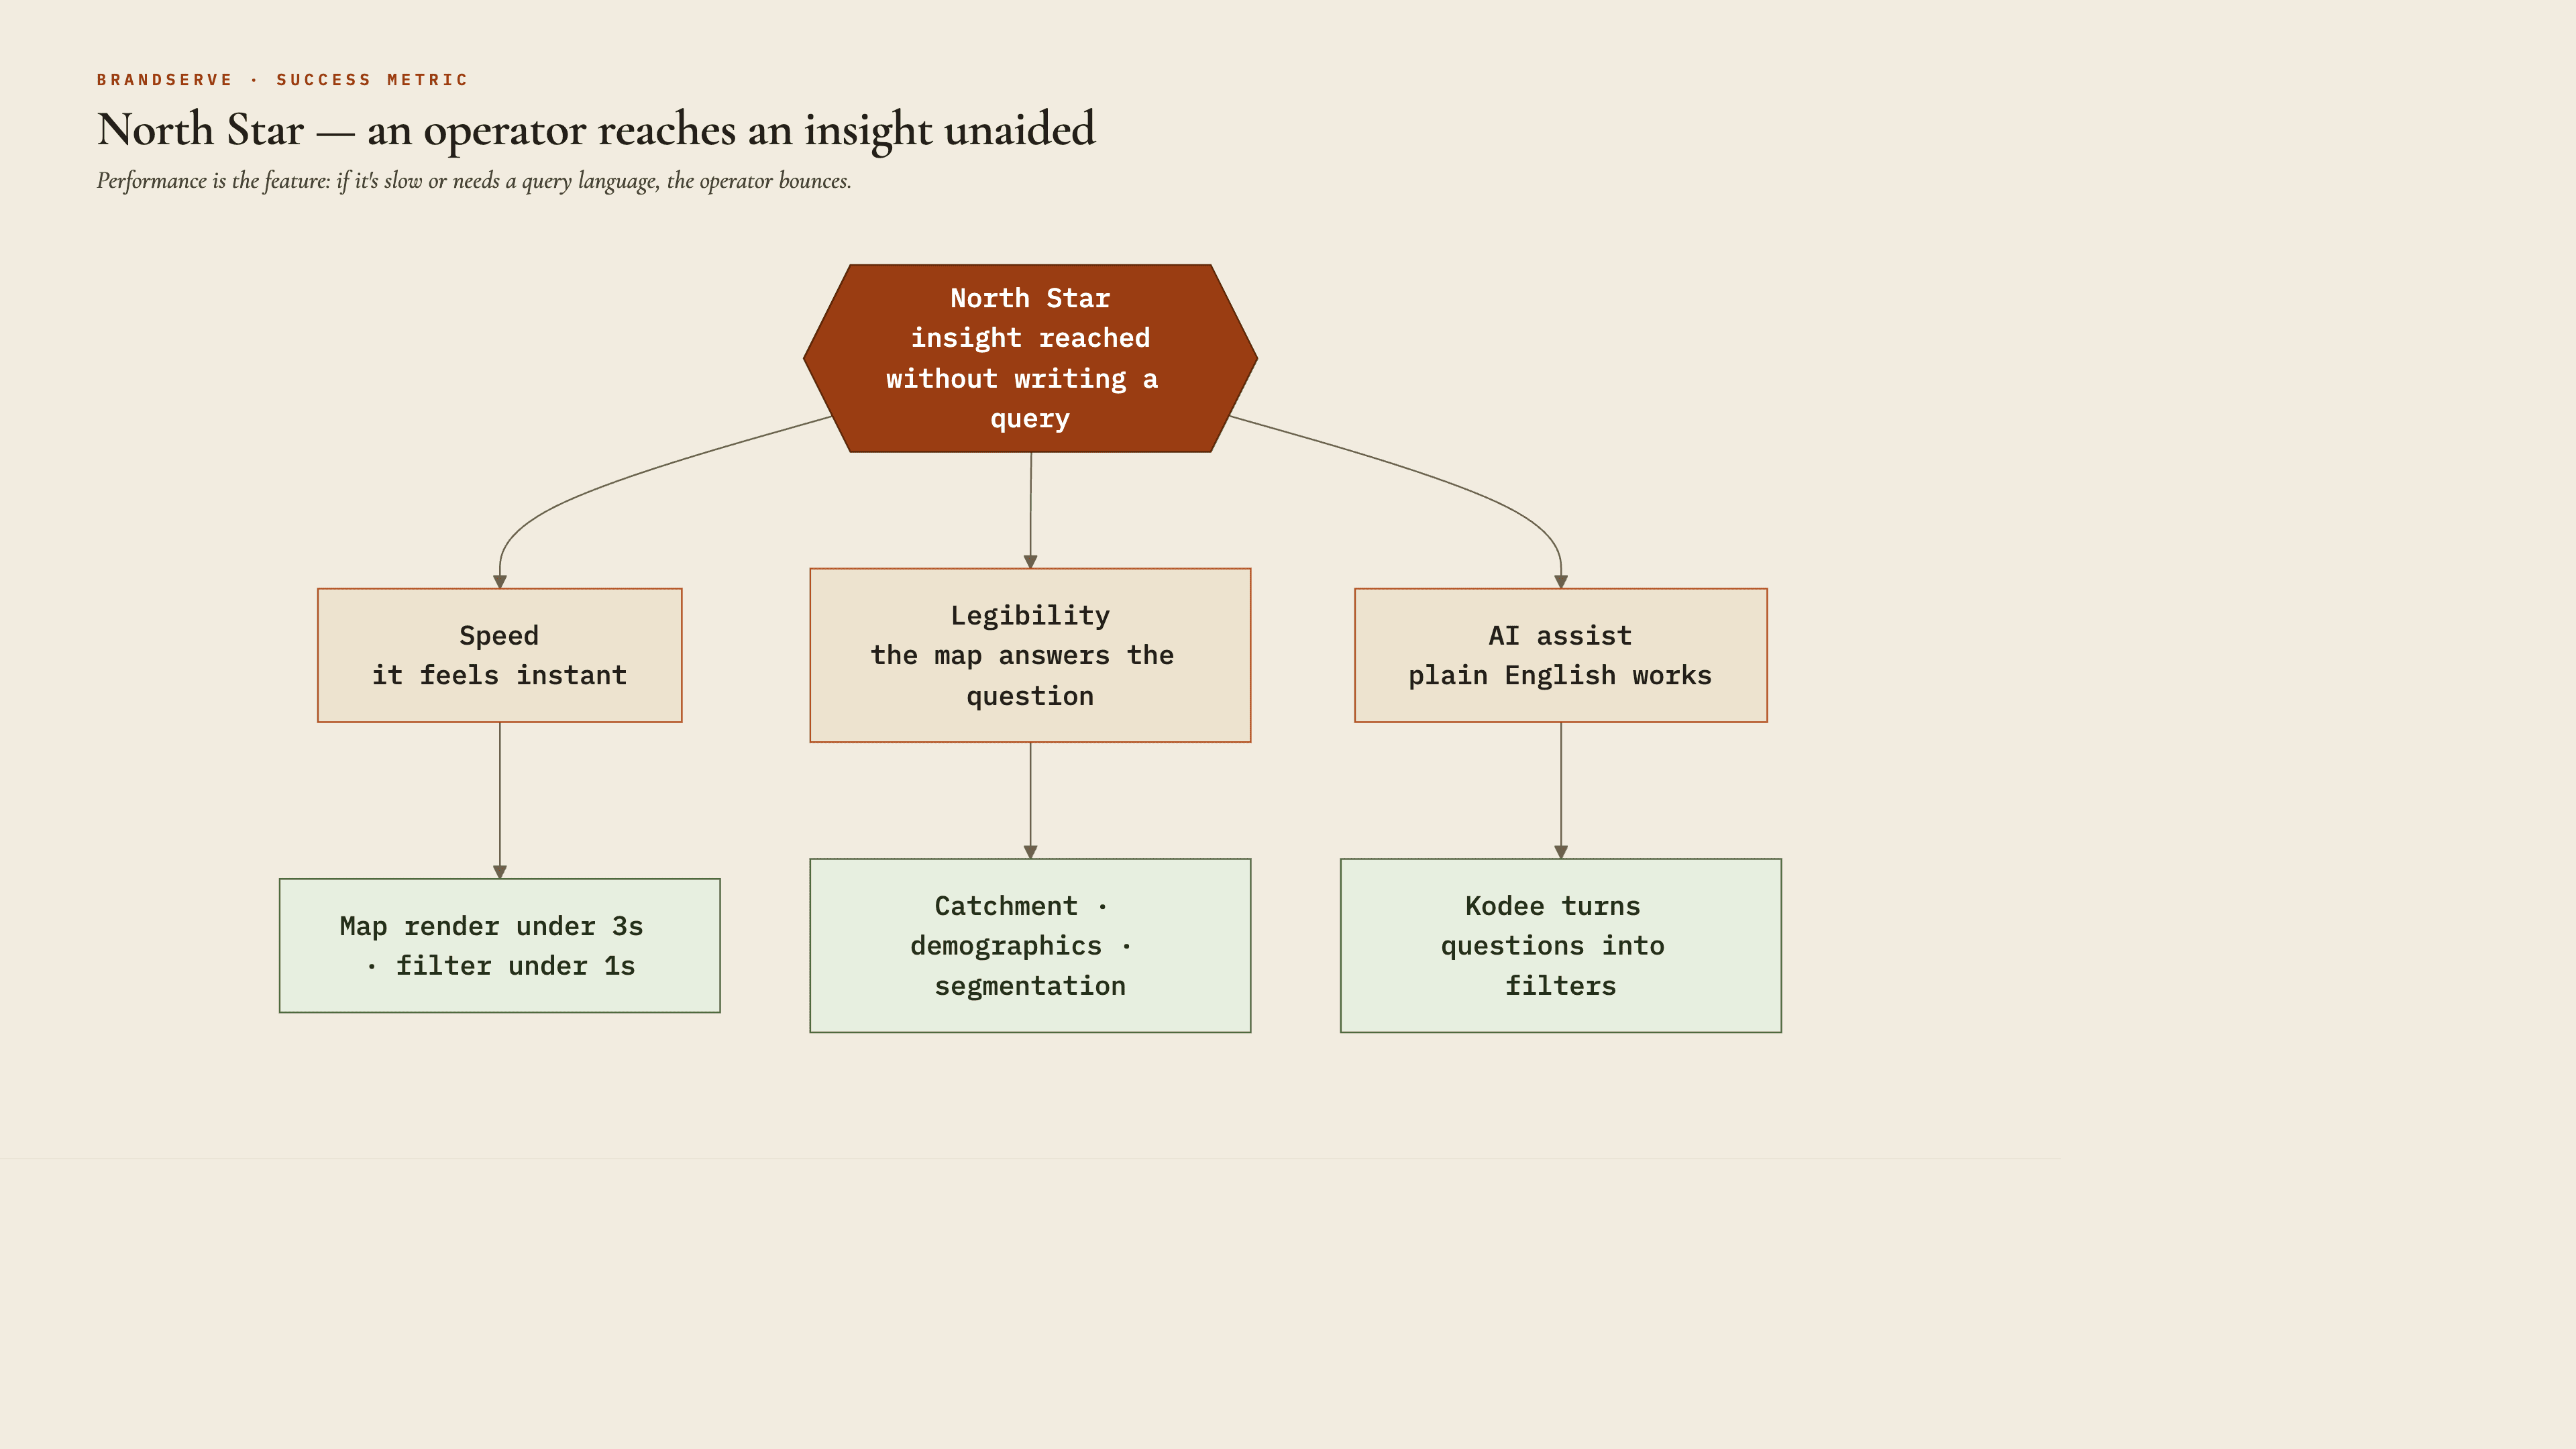
Handle 100MB+ pin reports in the browser, render the map within three seconds, and keep filter updates under one second for datasets up to ~20,000 points.
Surface multi-dimensional filtering (site, polygon, dwell, day, distance) combined via AND logic, plus an AI layer so operators can ask in plain English.
Strategic Approach
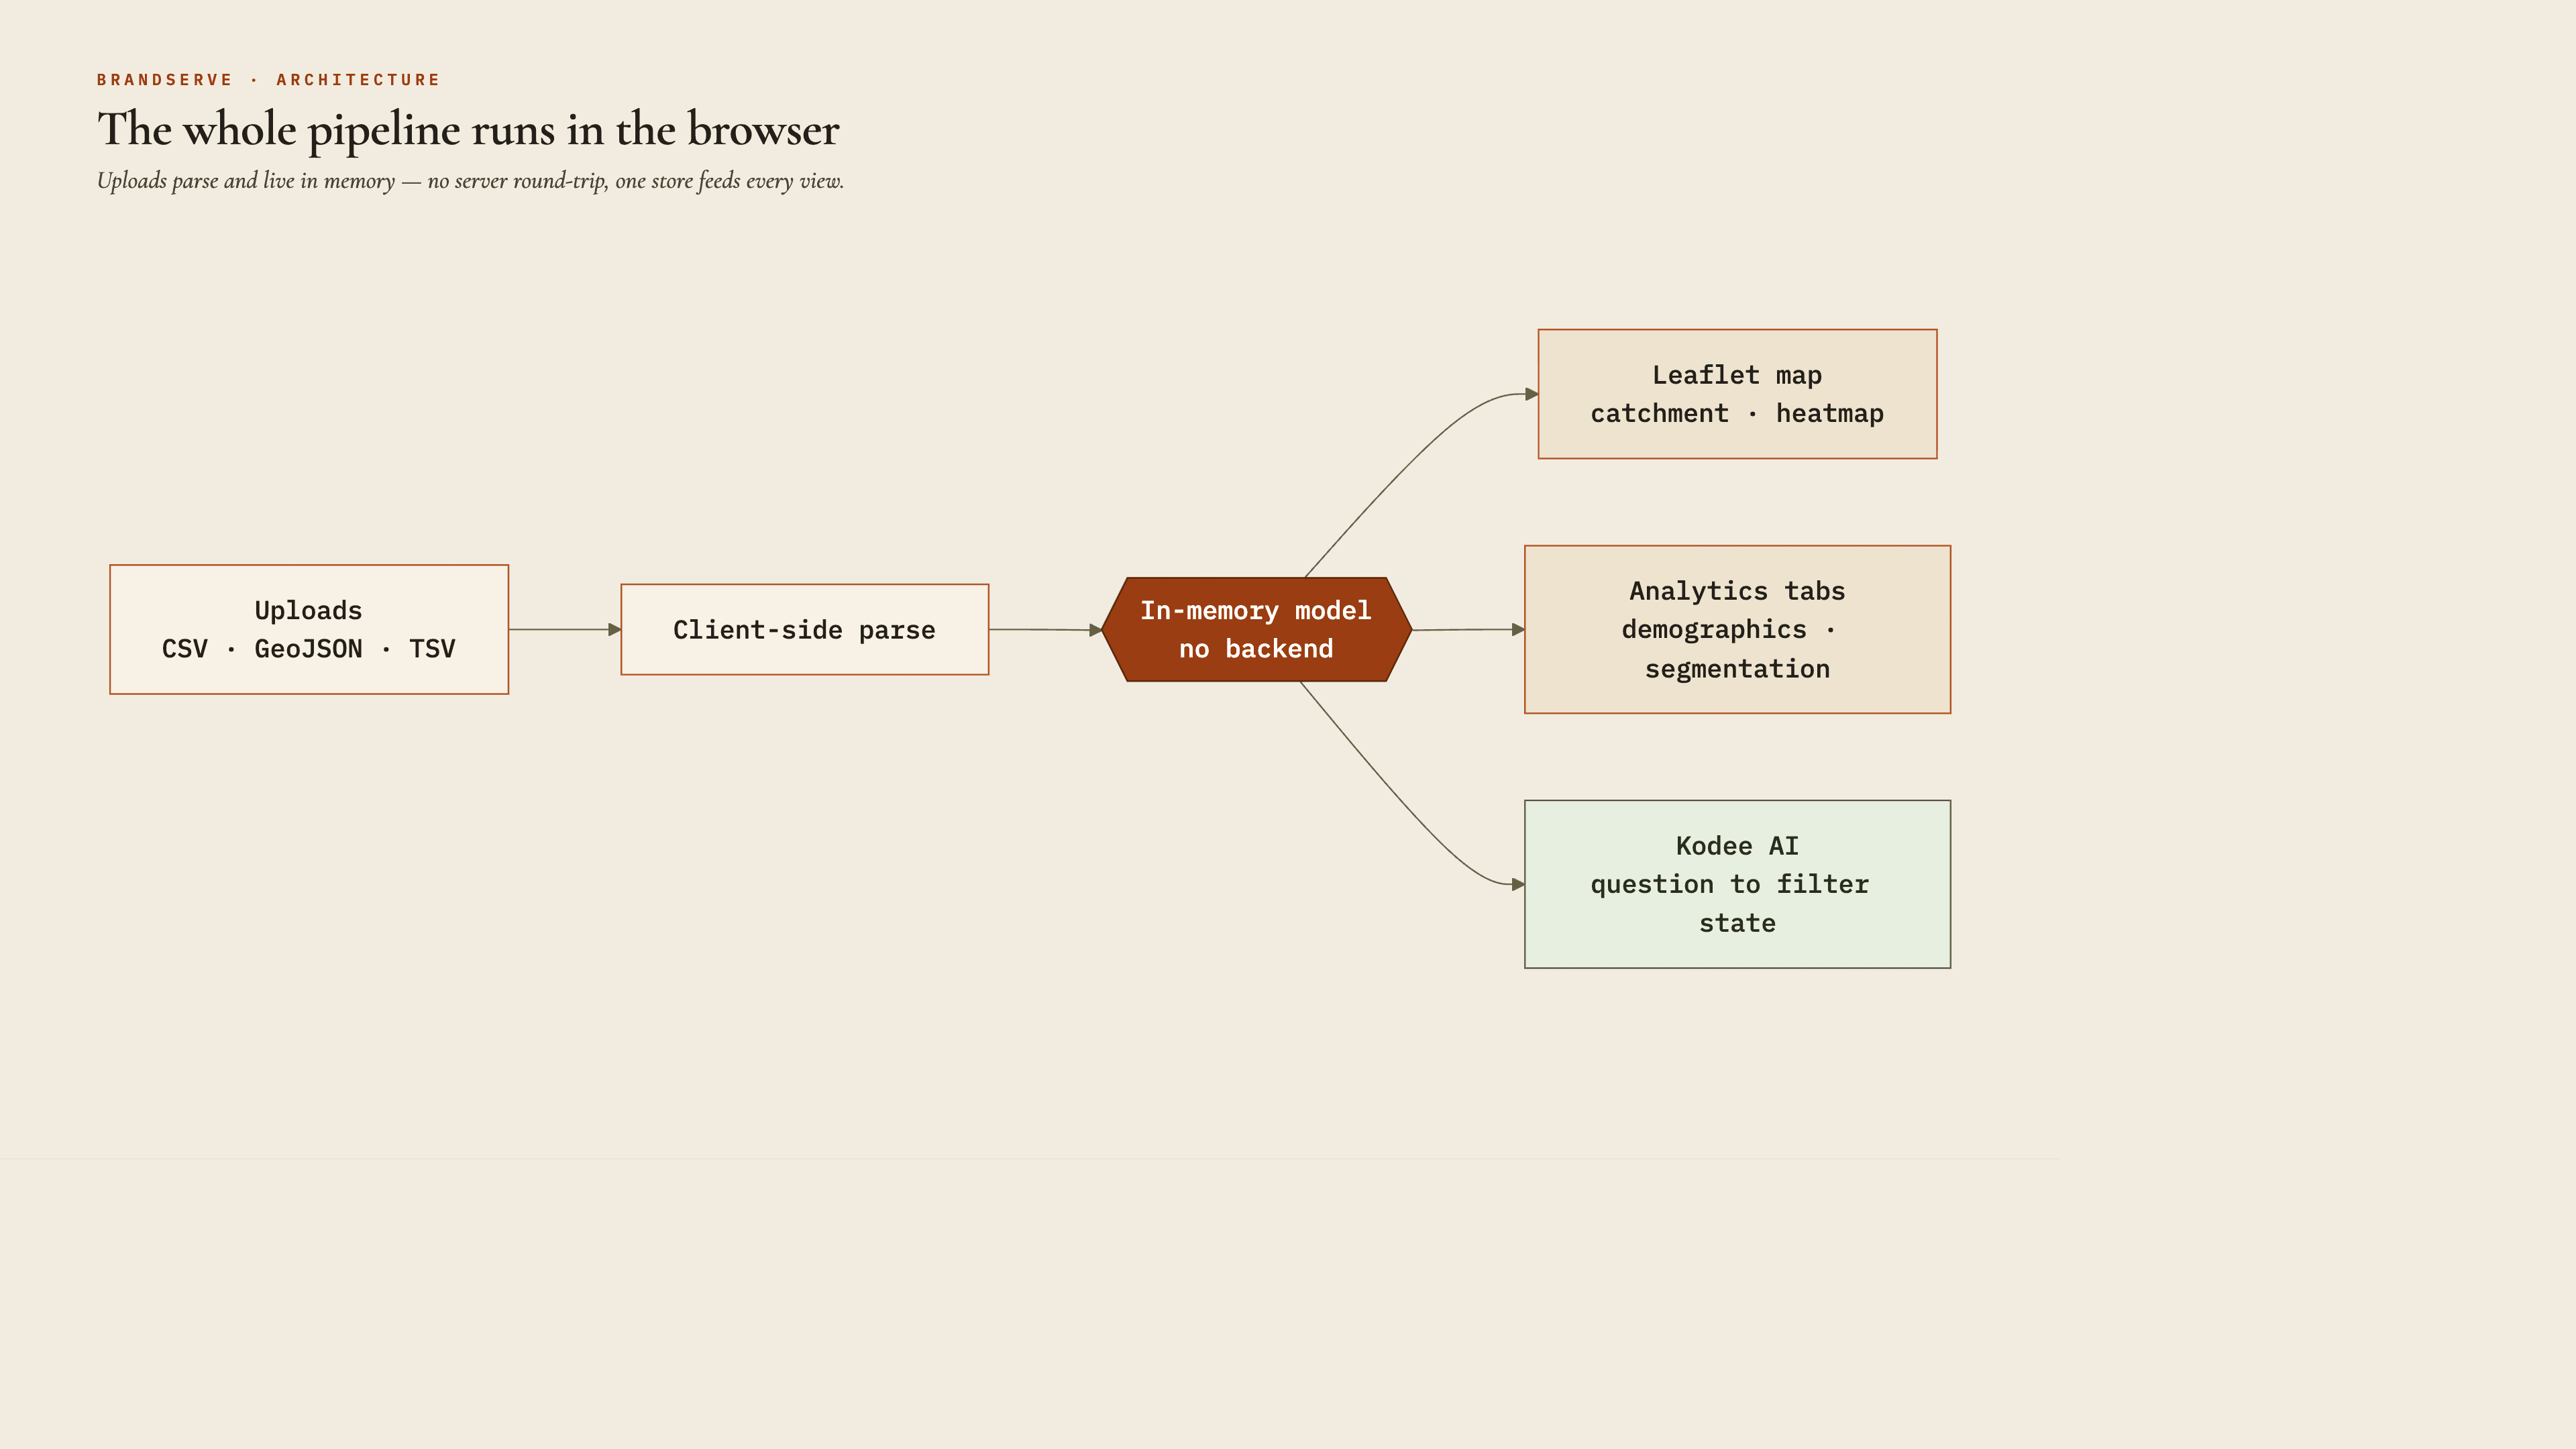
Re-architect as a client-side React SPA: uploads (CSV/GeoJSON/TSV) parse and live in memory, so the dashboard works without a server round-trip. Layer visualization on Leaflet with heatmaps, clustering, and catchment rings, drive the analytics tabs from the same in-memory store, and add a Claude-powered assistant that translates questions into filter state.
Execution
Data Layer
Built client-side parsers for site locations, CEL data, dwell/distance, and large pin reports, normalizing them into one in-memory model.
Map & Visualization
Implemented the Leaflet map with site markers, catchment radius rings, point scatter, and a heatmap overlay across Carto and satellite basemaps.

Analytics Tabs
Designed Visitation, Catchment/Trade Area, Demographics, Segmentation, and Insights views driven by the shared filter state.

AI Assistant
Wired in Kodee, a natural-language assistant that interprets questions and auto-applies the corresponding filters.
Outcomes
Rebuilt a no-code-dependent tool into a standalone React SPA that ingests 100MB+ datasets and renders catchment, demographics, and segmentation with no backend.
Impact
- •Freed the product from a no-code host by moving the entire pipeline into the browser.
- •Made large, messy location datasets explorable by non-technical venue operators.
- •Lowered the barrier to insight with an AI assistant that turns questions into map state.
Reflections
Decisions, tradeoffs, and what I'd change.
- 01
Started on a no-code builder (Base44) to validate the idea fast, then ejected to a real Vite codebase once the data pipeline outgrew it — the right tool to start with, the wrong one to ship on.
- 02
Said no on principle: share-links, scheduled emails, and predictive forecasting all needed a backend or were overkill for a client-side tool, so I cut them and let PDF export cover the sharing use-case.
- 03
I catalogued the debt instead of hiding it — client-side API-key exposure, a 1,700-line dashboard component, no mobile layout — and those are the first things I'd refactor before this goes near scale.
Gallery

Key decision: Base44 was the right tool to start, the wrong tool to ship — eject when the pipeline outgrows it.

And it ships: device observations mapped and aggregated per site, entirely client-side.